Image taken on
Jul 20, 2016, 12:15 PM
by
User Not Found
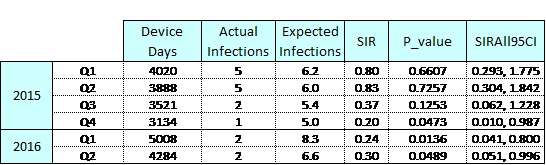
Columns in chart: Device days; actual infections; expected infections; SIR; P_value: SIRAII95CI. Results are posted quarterly. Q1 2015 - 4020; 5; 6.2; 0.80; 0.6607; 0.293, 1.775 Q2 2015 - 3888; 5; 6.0; 0.83; 0.7257; 0.304, 1.842 Q3 2015 - 3521; 2; 5.4; 0.37; 0.1253; 0.062, 1.228 Q4 2015 - 3134; 1; 5.0; 0.20; 0.0473; 0.010, 0.987 Q1 2016 - 5008; 2; 8.3; 0.24; 0.0136; 0.041, 0.800 Q2 2016 - 4284; 2; 6.6; 0.30; 0.0489; 0.051, 0.996