Emergency Department (ED) throughput work
21 Feb 2016By: Paul Gramenz, MD, medical director, Salem Emergency Physicians Service
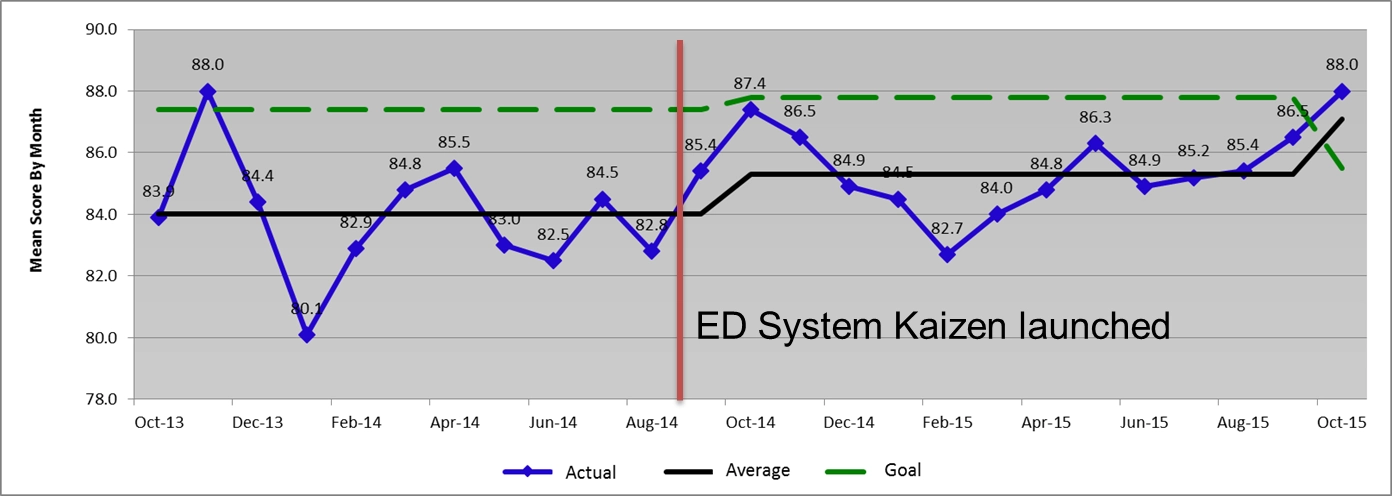
Decreased patient experience scores, increased ED length of stay, an increase in the rate of those left without being seen, and increased time from the patient presenting at the ED until time to see a doctor: All were problems the Salem Hospital ED experienced in 2014.
The ED continues to face an increased census along with an increase in the number of emergent cases. Over the past 10 years, the number of inpatients admitted through the ED has grown from 22 to 66 percent. Due to these problems, improving ED throughput was selected as one patient experience strategy in fiscal year 2015.
I worked with ED leadership to address these problems. Leaders and staff from a variety of areas such as Imaging, Lab, Patient Transport and Access Services joined together to view the work from the patient perspective. Using four-step problem solving based on the scientific method of plan-do-check-adjust, teams ran multiple tests of change over the course of the year.
One significant test of change was implementing a provider at triage. Of all the tests of change, this had the greatest impact. The provider at triage moves the provider and patient interaction to earlier in the process, helping to expedite care of the patient. A provider at triage is available 10 a.m. to 10 p.m. each day and is staffed with two physicians, each working a 6-hour shift along with ED nurses and technicians. Nurses screen the patients in triage and based on standard criteria, determine the less emergent patients that can be seen by the provider in the triage area. With this work done up front, the less emergent patient does not have to go to the back of the ED and occupy a bed needed by a more acute patient.
Implementation of a “results pending area” in the lobby has also freed up rooms in the back of the ED for more acute patients, creating better flow within the department.
Another example of a test of change was the Patient Transport Department starting a “bus route.” Rather than waiting for a call to get a patient for imaging, the Patient Transport Department actively rotates through the ED to take patients to and from Imaging.
Excellent results were obtained from the work done in fiscal year 2015 and continued efforts extend into 2016:
Patient Experience
FY 14 mean score: 84.0, 71 percentile
FY 15 mean score: 85.3, 68 percentile
FY 16 YTD (thru December) mean score: 87.1, 92 percentile

|
% Left without being seen |
Length of stay |
Door to Doc Time |
|
Baseline: 5.28% |
Baseline: 248 minutes |
Baseline: 83 minutes |
|
FY ’15: 3.66% |
FY ’15: 226 minutes |
FY ’15: 67 minutes |
|
October FY ’16: 2.09% |
October FY ’16: 207 minutes |
October FY ’16: 50 minutes |